29 Sep 2015 Packetbeat
Continuing our quest for a replacement for OpsView, we stumbled upon Packetbeat monitoring system. Although it’s not exactly a fully fledged monitoring system, since it doesn’t include any method for alerting, it could provide excellent insights when troubleshooting complex issues involving a lot of moving parts (because Packetbeat sniffs data passing through the network interface and analyzes that data).
We are an Ansible shop. We were intrigued to use their “Packetbeat deploy” Ansible playbook which can deploy the whole system automatically for you. So I got myself a couple of droplets and cloned the packetbeat-deploy files on my laptop and we’re ready to go.
I created the inventory file with the IP addresses of my servers (I am using 2 servers; 1 to-be-monitored-app-server and the other will be the aggregator and the Elasticsearch node). As we usually do, I –checked first. I get this error:
[code]msg: ‘apt-get install ‘java7-runtime-headless’ ‘ failed: E: Package ‘java7-runtime-headless’ has no installation candidate[/code]
I’m using a stock DO Ubuntu 14.04 instance, which only had OpenJDK in its repositories, so I had to edit the esnodes role (roles/esnode/tasks/main.yml) and replace
[code]pkg=java7-runtime-headless[/code]
with
[code]pkg=openjdk-7-jre-headless[/code]
After that the playbook ran successfully.
Now I will use one of our Ansible playbooks to deploy a PHP application (let that be WordPress) with Nginx/phpfpm and bombard it with seige to create some data to be displayed.
I edited the Packetbeat configuration (roles/packetbeat/vars/main.yml) to add the php-fpm port and process (turns out Packetbeat does not support php-fpm yet) and disabled pgsql and redis configurations.
[code]
protocols:
http:
enabled: true
ports:
– 80
– 8080
mysql:
enabled: true
ports:
– 3306
pgsql:
enabled: true
ports:
– 5432
redis:
enabled: true
ports:
– 6379
processes:
mysqld:
enabled: true
cmdline_grep: ‘mysqld’
pgsql:
enabled: true
cmdline_grep: ‘postgres’
nginx:
enabled: true
cmdline_grep: ‘nginx’
redis:
enabled: true
cmdline_grep: ‘redis’
[/code]
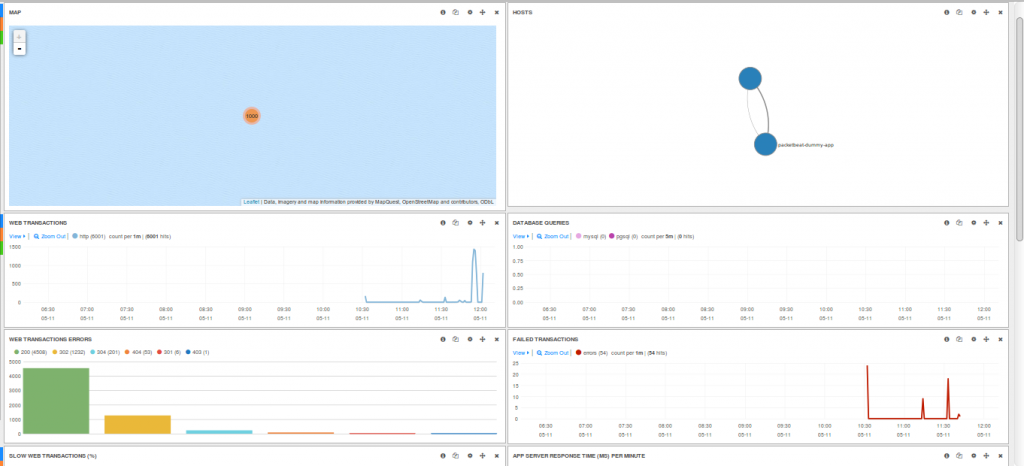
This is how it looked:

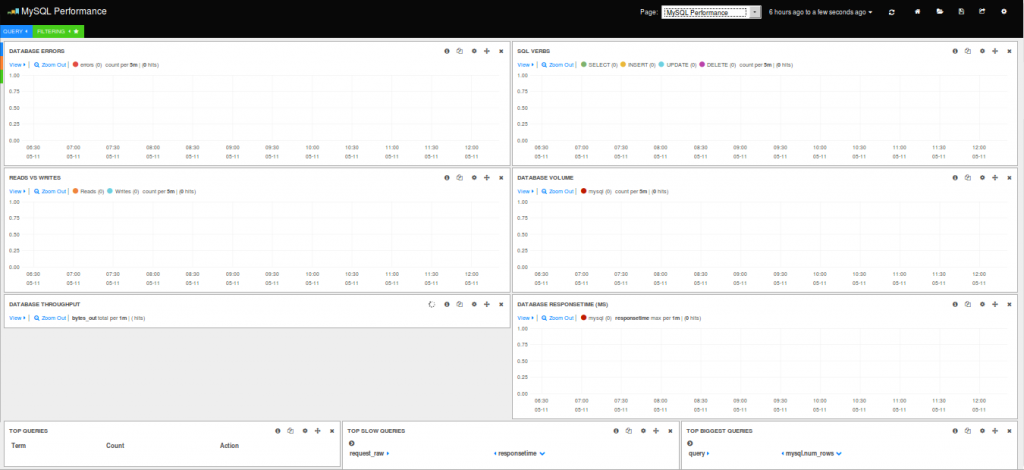
I noticed that none of the MySQL graphs was showing any data:
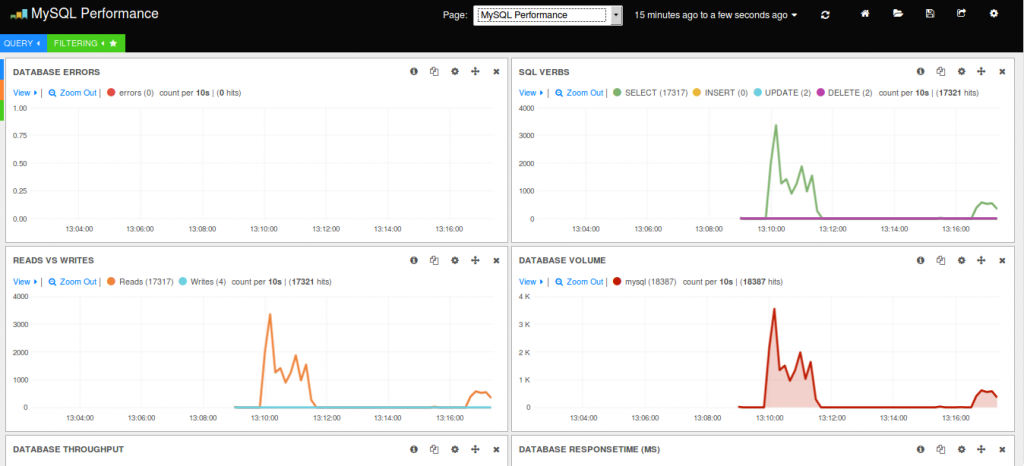
I forgot how smart WordPress is; It automatically connects to the database over the socket if the DB_HOST was set to “localhost”. I changed that to 127.0.0.1 and Packetbeat was able to sniff the packets correctly and data started showing up on Kibana.
Now I want to see php-fpm data. I didn’t know why it wasn’t showing up until I re-RTFM-ed and found that they only support a limited number of protocols for now. Also, It seems that Packetbeat does not support multiple-application setups.
Summary
This easily-deployed new monitoring system would be very helpful if you are administering a single distributed application; You will have pretty good visibility through your app cluster. It can help you debug and “see” issues in a relatively complex setup. However, it’s still at early development stages and has a long way to go.


